Dashboard
The dashboard is a live admin UI that gives you real-time visibility into every task your application runs, with controls to inspect, retry, cancel, and export them, all without writing any extra code.
Accessing the Dashboard
The dashboard is mounted automatically when you use TaskAdmin:
You can mount it at a custom path:
If you have configured authentication, you will be prompted to log in before the dashboard loads:
See the Authentication guide for full details on protecting the dashboard and API endpoints.
Dark Mode
The dashboard supports a light and dark theme. Use the sun/moon toggle in the top-right corner to switch. Your preference is saved in localStorage and restored on your next visit. All tabs, cards, and controls adjust automatically.
The View Tab
The View tab is the main task table. It updates live over a Server-Sent Events stream, so you see new tasks and status changes the moment they happen, with no polling and no page refresh.
Columns
Each row in the table shows:
| Column | What it shows |
|---|---|
| ID | The task UUID, with a copy-to-clipboard button |
| Function | The registered function name |
| Queue | The named queue this task was routed into. Shows default when the named queue system is not active |
| Status | Current status badge |
| Duration | Wall-clock time from start to end |
| Retries | Number of retry attempts consumed |
| Created | When the task was enqueued |
| Error | A short summary of the exception, if any |
Columns are sortable by clicking the column header. Your sort preference is saved in localStorage and restored on your next visit.
Metrics Row
Above the table, a row of stat cards summarises the current filtered view:
| Stat | What it shows |
|---|---|
| Total | Count of all tasks matching the active filters |
| Pending / Running / Success / Failed / Interrupted / Cancelled / Rejected | Count per status |
| Success rate | Percentage of terminal tasks that ended in success |
| Avg duration | Mean wall-clock time across completed tasks |
| Min / Max duration | Fastest and slowest recorded run |
| P95 duration | The 95th-percentile duration, useful for spotting outliers |
Filtering and Search
Controls in the filter panel let you narrow the task table:
- Status dropdown filters to a single status: pending, running, success, failed, interrupted, cancelled, or rejected.
- Function dropdown narrows the table to one registered function.
- Time-range picker shows tasks created within a chosen window. You enter a number and pick a unit (minutes, hours, or days).
- Queue dropdown narrows the table to tasks in a single named queue. Only visible when the named queue system is active. Includes all queues that have had tasks routed into them.
- Export CSV downloads the current filtered view.
- Clear history deletes terminal tasks older than a chosen window.
- Search bar sits below the metrics cards, spanning their width. It matches against both the task ID and the function name as you type. Your search term is persisted in
localStorageacross reloads.
All active filters combine: a task must pass every one of them to appear in the table. The table paginates at 30 tasks per page.
Timestamps and timezones
Task times (created_at, started, ended) are stored and transmitted as UTC, and the dashboard renders them in your browser's local timezone, with the zone abbreviation shown alongside each time (e.g. "Jul 15, 2:32:01 PM PDT"). The time-range picker compares against your browser's current time, so "last 6 hours" always means the 6 hours before your local now, regardless of where the server is deployed.
Task Detail Panel
Click any row to open a slide-in detail panel for that task.
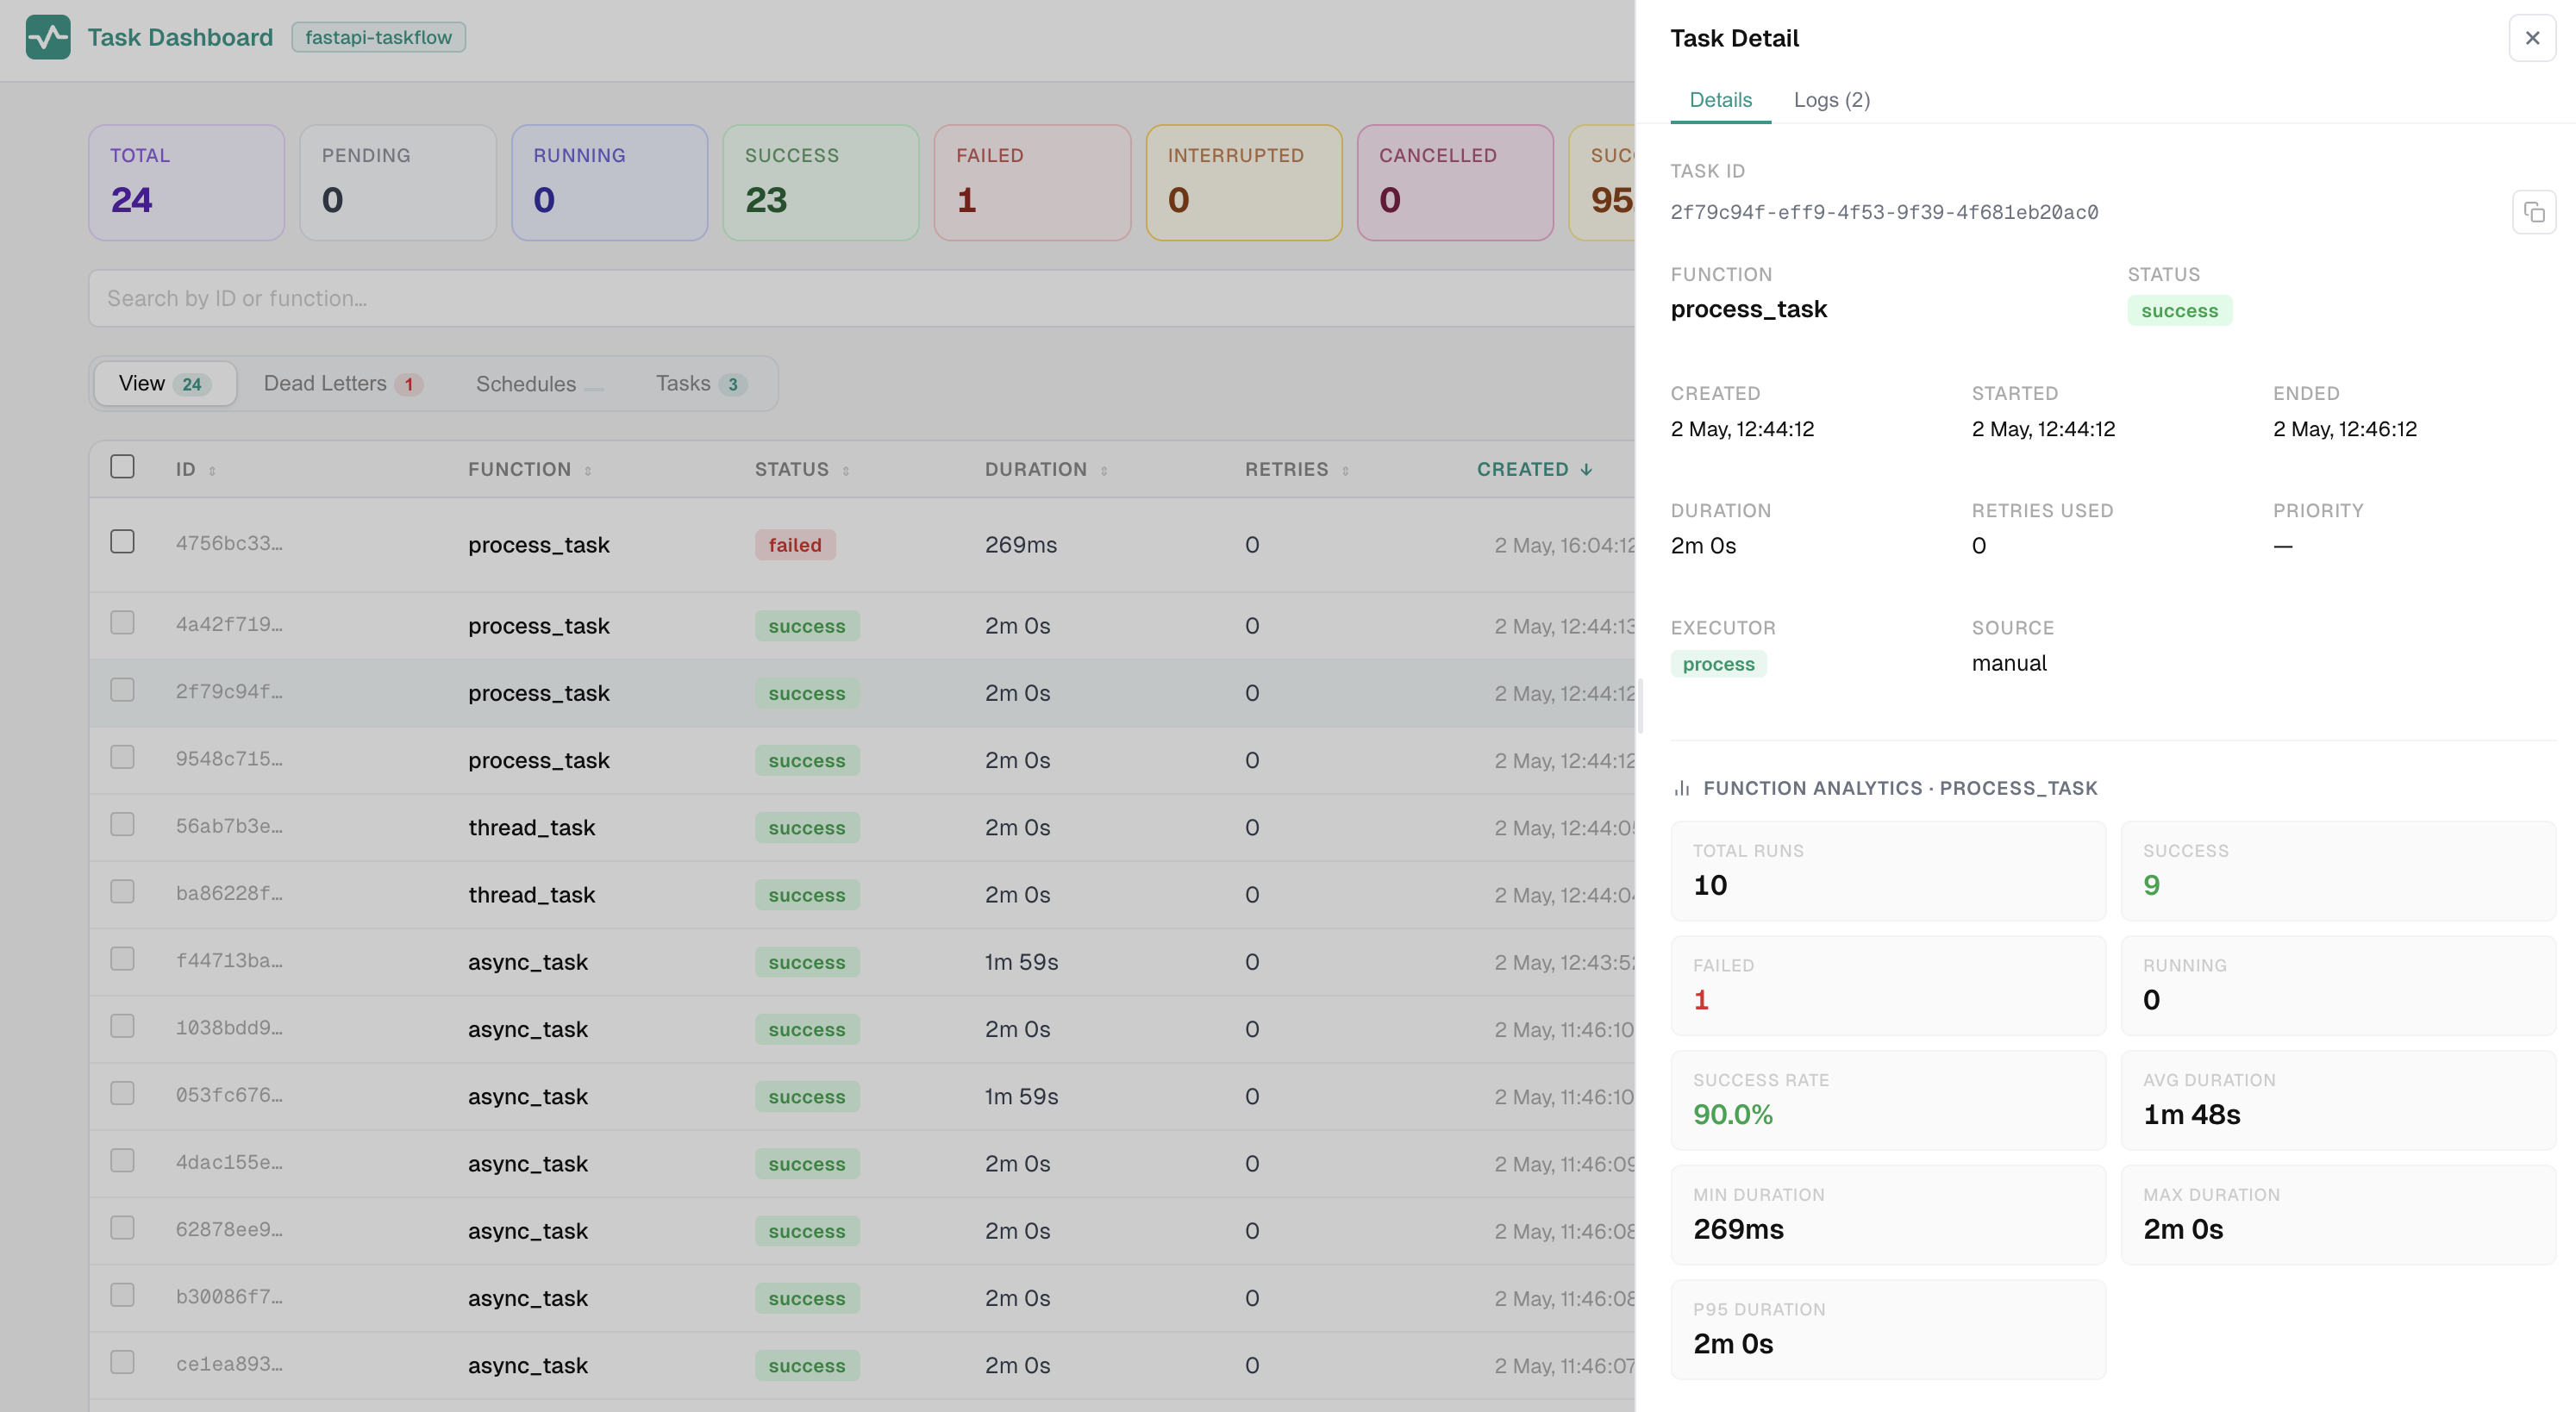
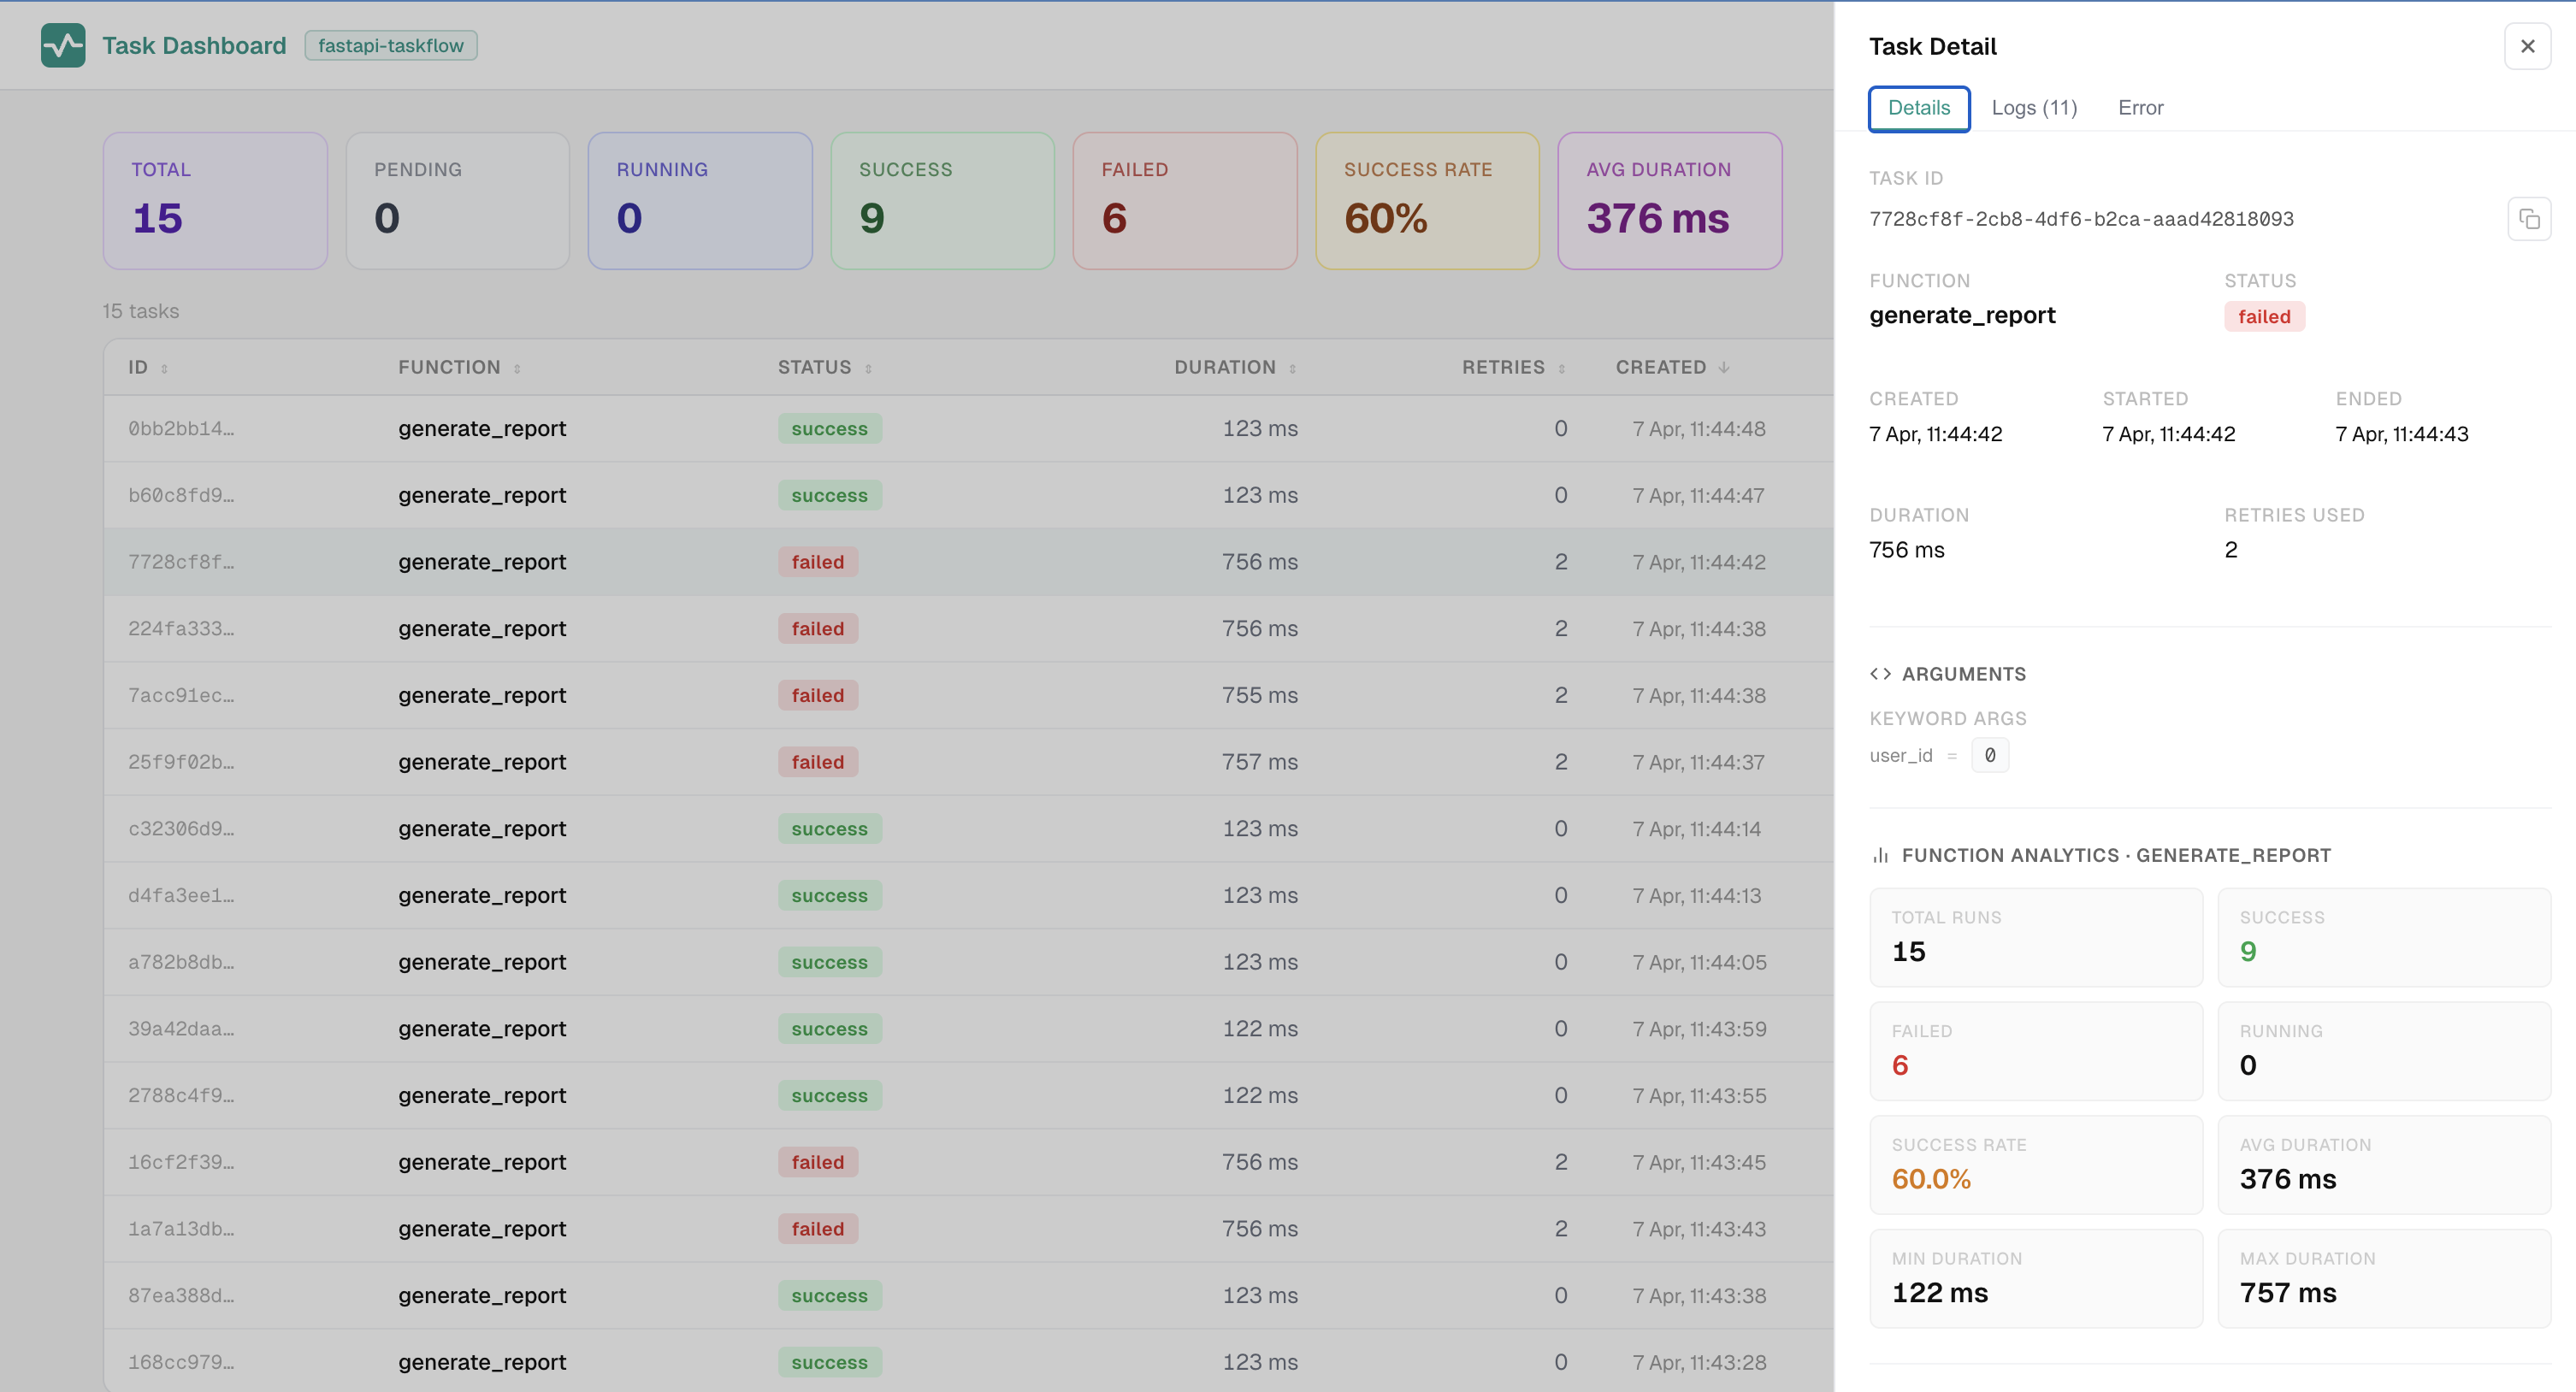
Details Tab
The Details tab shows everything about the task:
- Task ID with a copy button
- Function name and current status
- Timestamps: created, started, and ended
- Duration and retry count
- Task arguments (when
display_func_args=Trueis set onTaskAdmin) - Per-function analytics: total runs, success and failure counts, success rate, avg/min/max/P95 duration across all recorded runs of the same function
- The five most recent runs of the same function, as a quick history
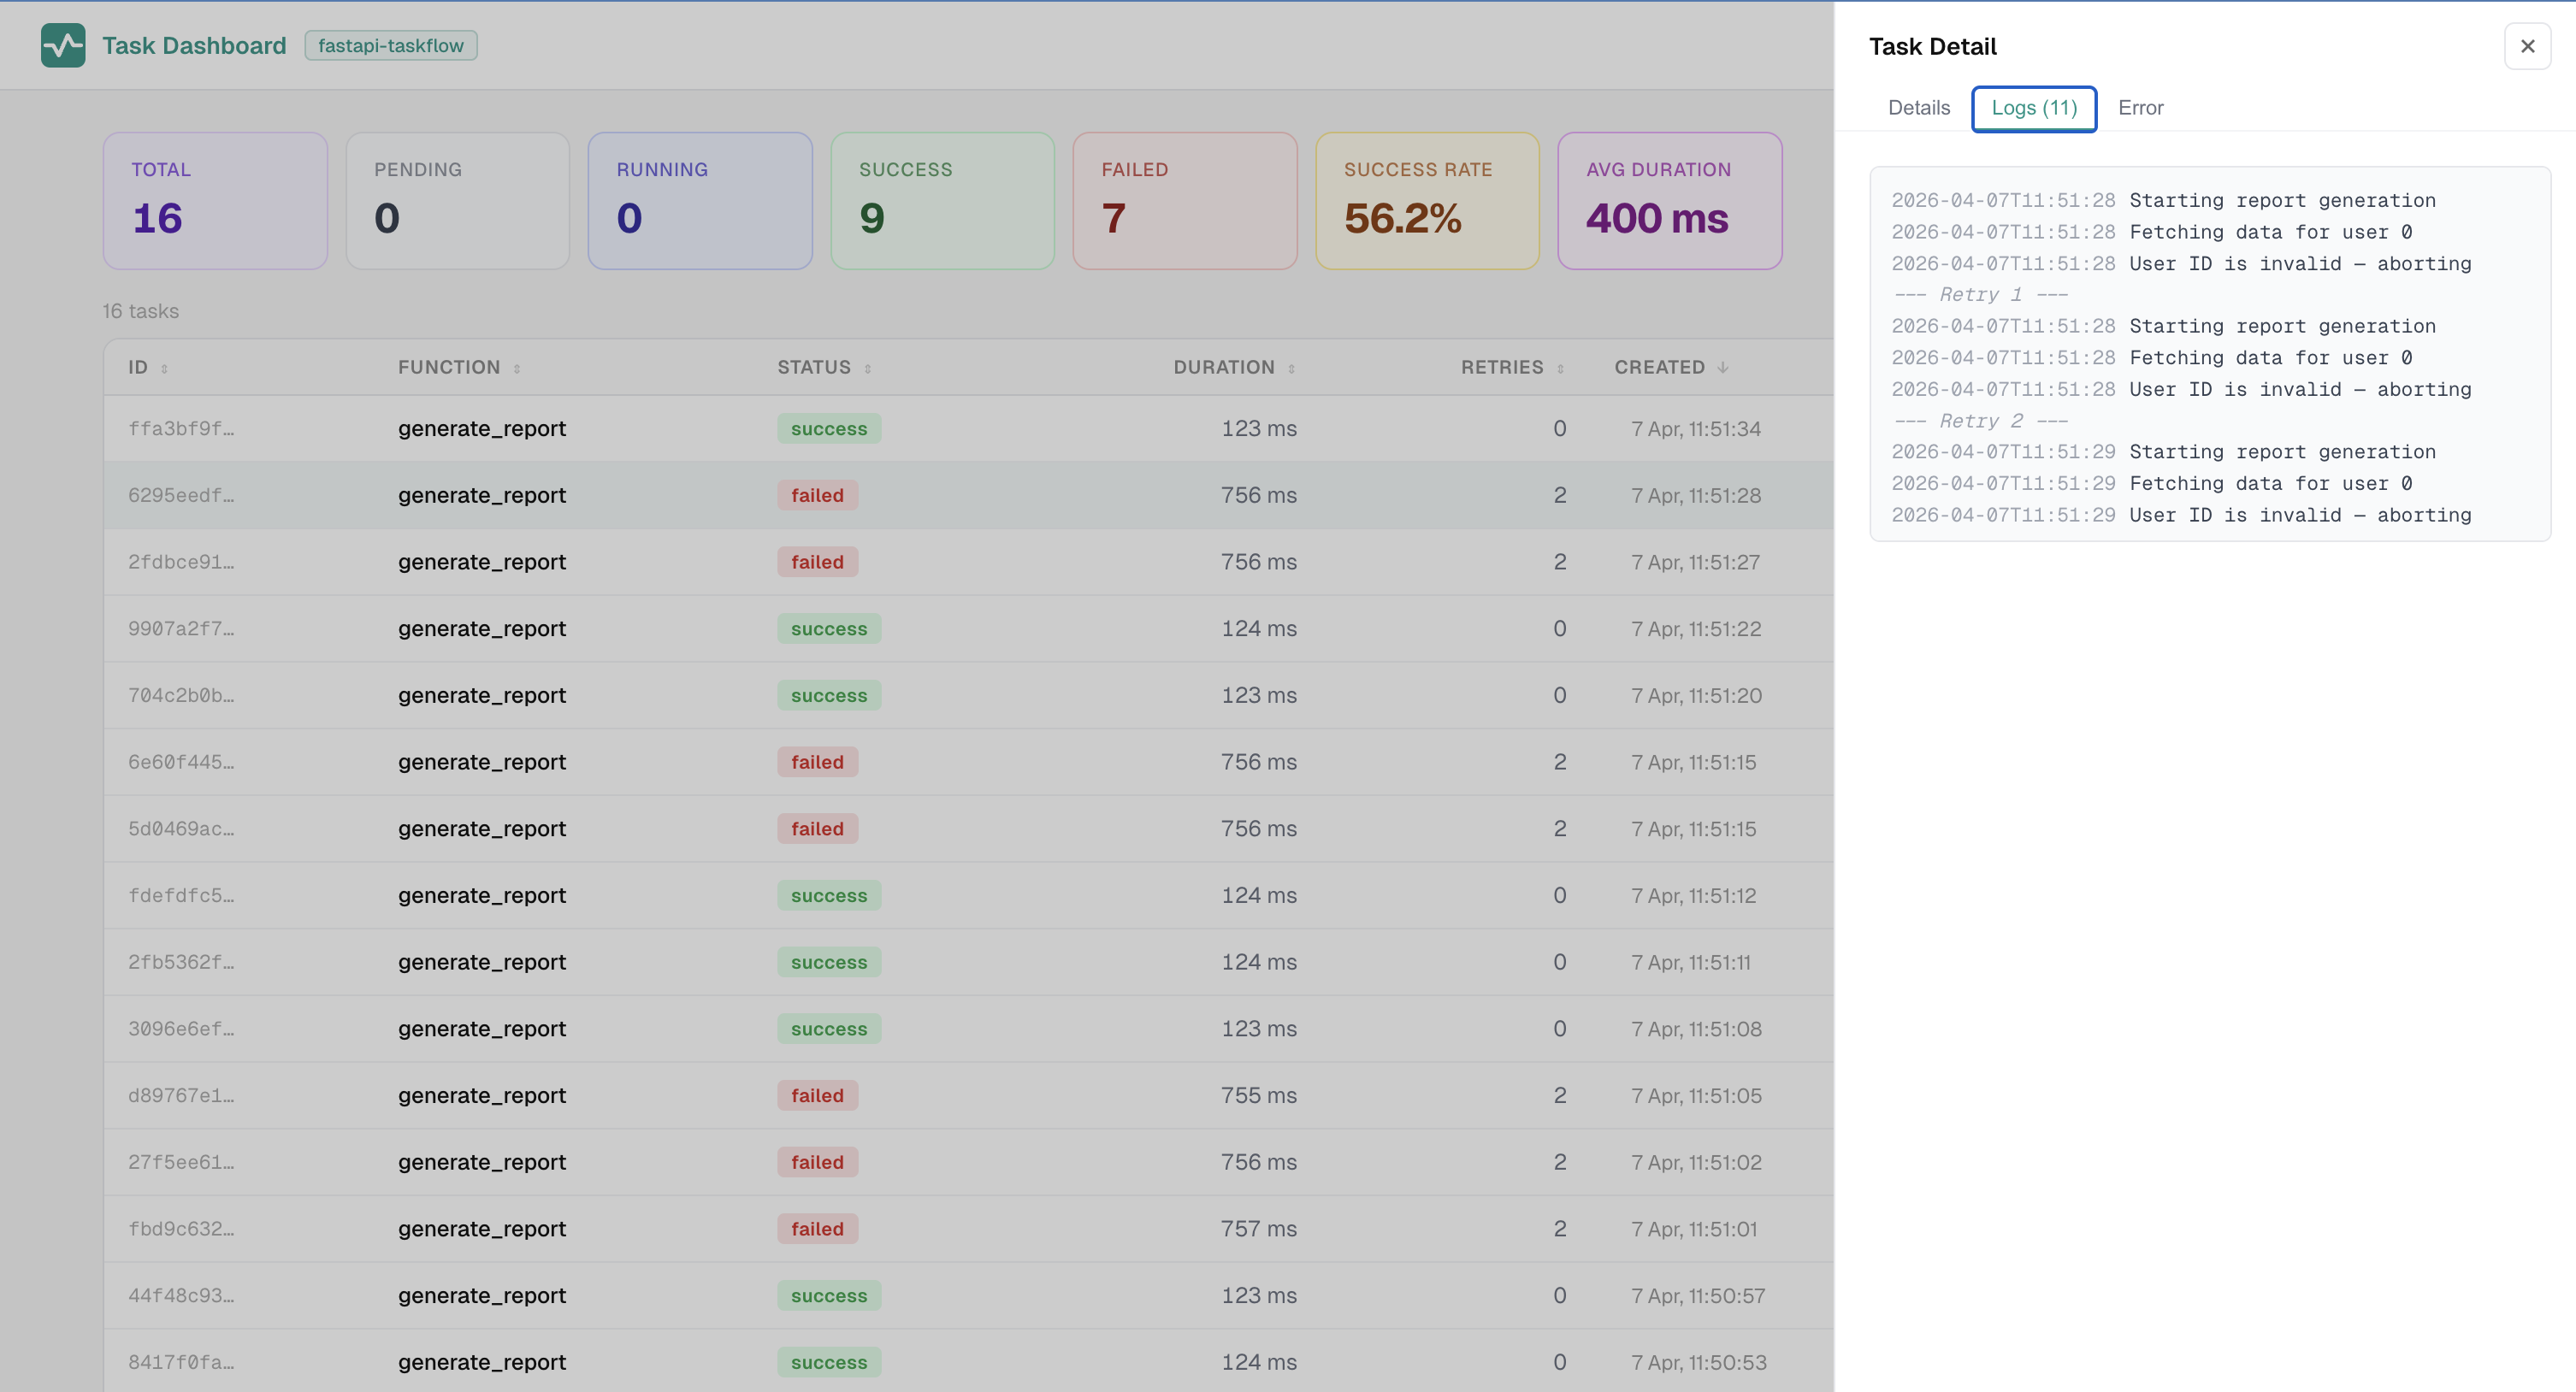
Logs Tab
The Logs tab appears when the task has captured log output. It shows the log lines emitted during that run.
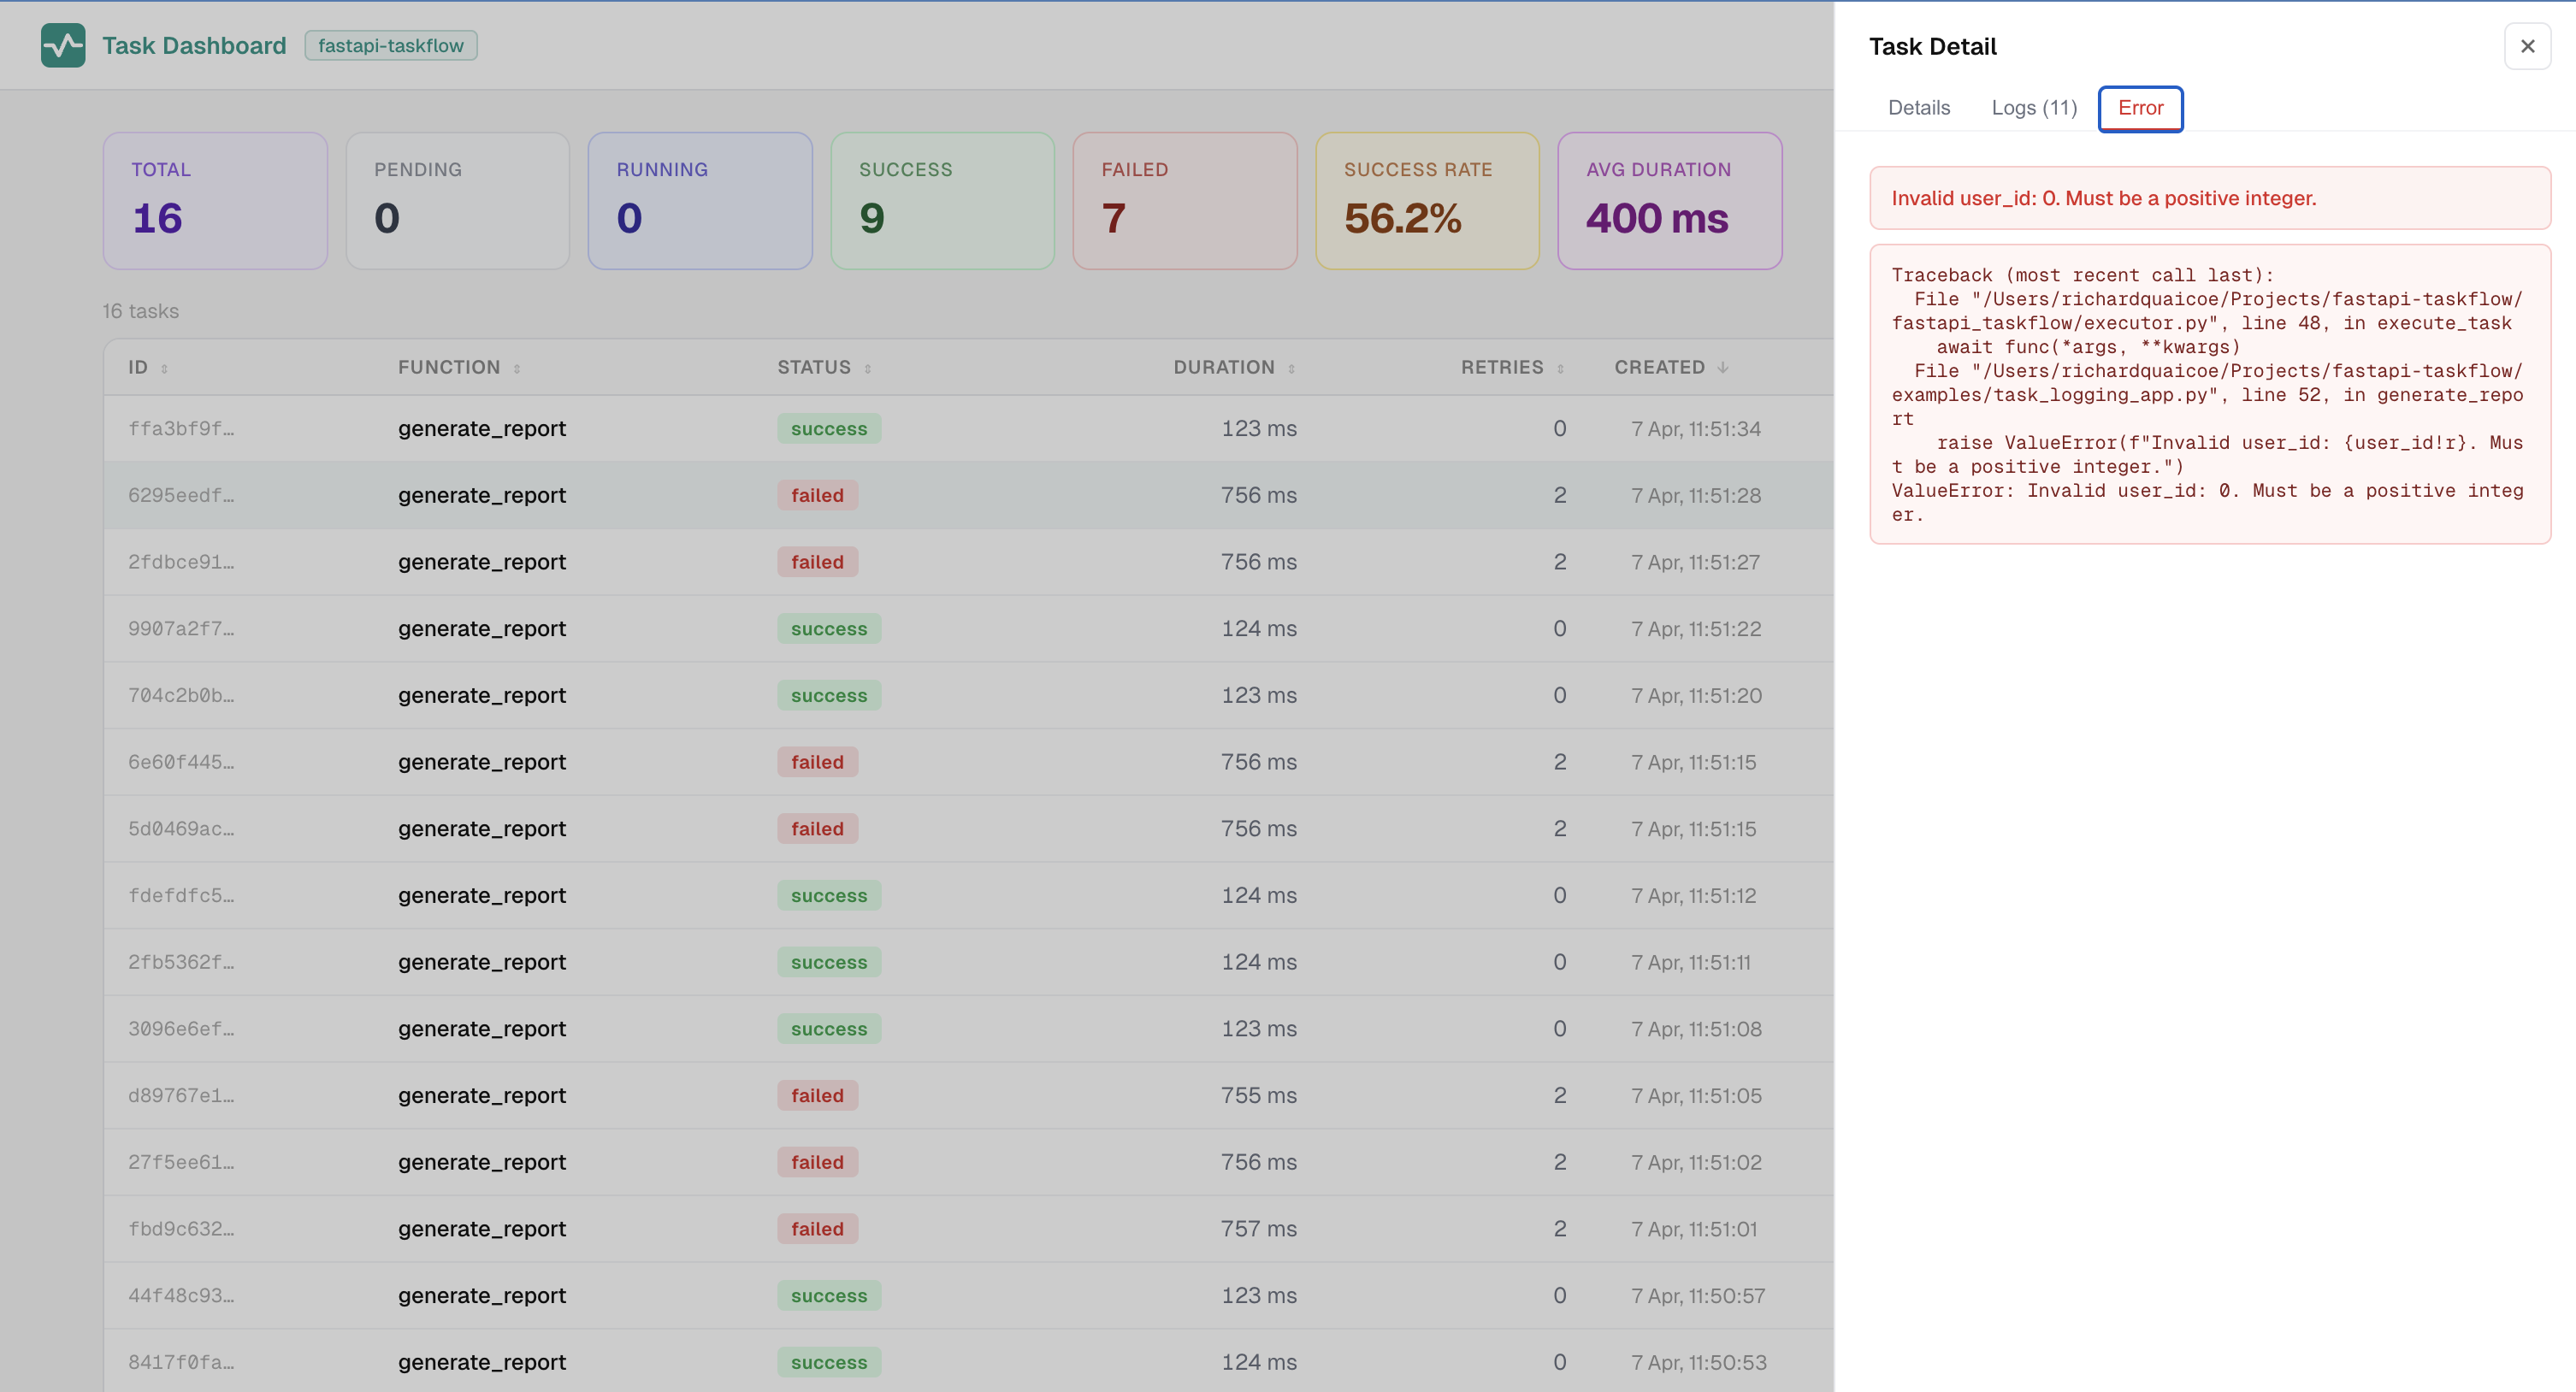
Error Tab
The Error tab appears when the task ended with an exception. It shows the full traceback so you can diagnose the failure without leaving the dashboard.
Action Buttons
The available buttons depend on the task's current status:
| Status | Action |
|---|---|
pending |
Cancel task sets the status to cancelled immediately. |
running |
Cancel task sends a cancellation signal to the asyncio task. A note in the panel explains that sync tasks (running in a thread pool) cannot be interrupted mid-thread. |
failed, interrupted, or rejected |
Retry this task creates a new task with the same function, args, and kwargs. When retry_replaces_original=True (the default), the original record is removed after the new task is dispatched. |
Warning
For interrupted tasks, the retry button shows a warning that the function may have already partially executed. Only retry if you know the function is safe to run again from the beginning.
Dead Letters Tab
The Dead Letters tab shows tasks with status failed or rejected, sorted newest first. The tab badge shows the current count at a glance.
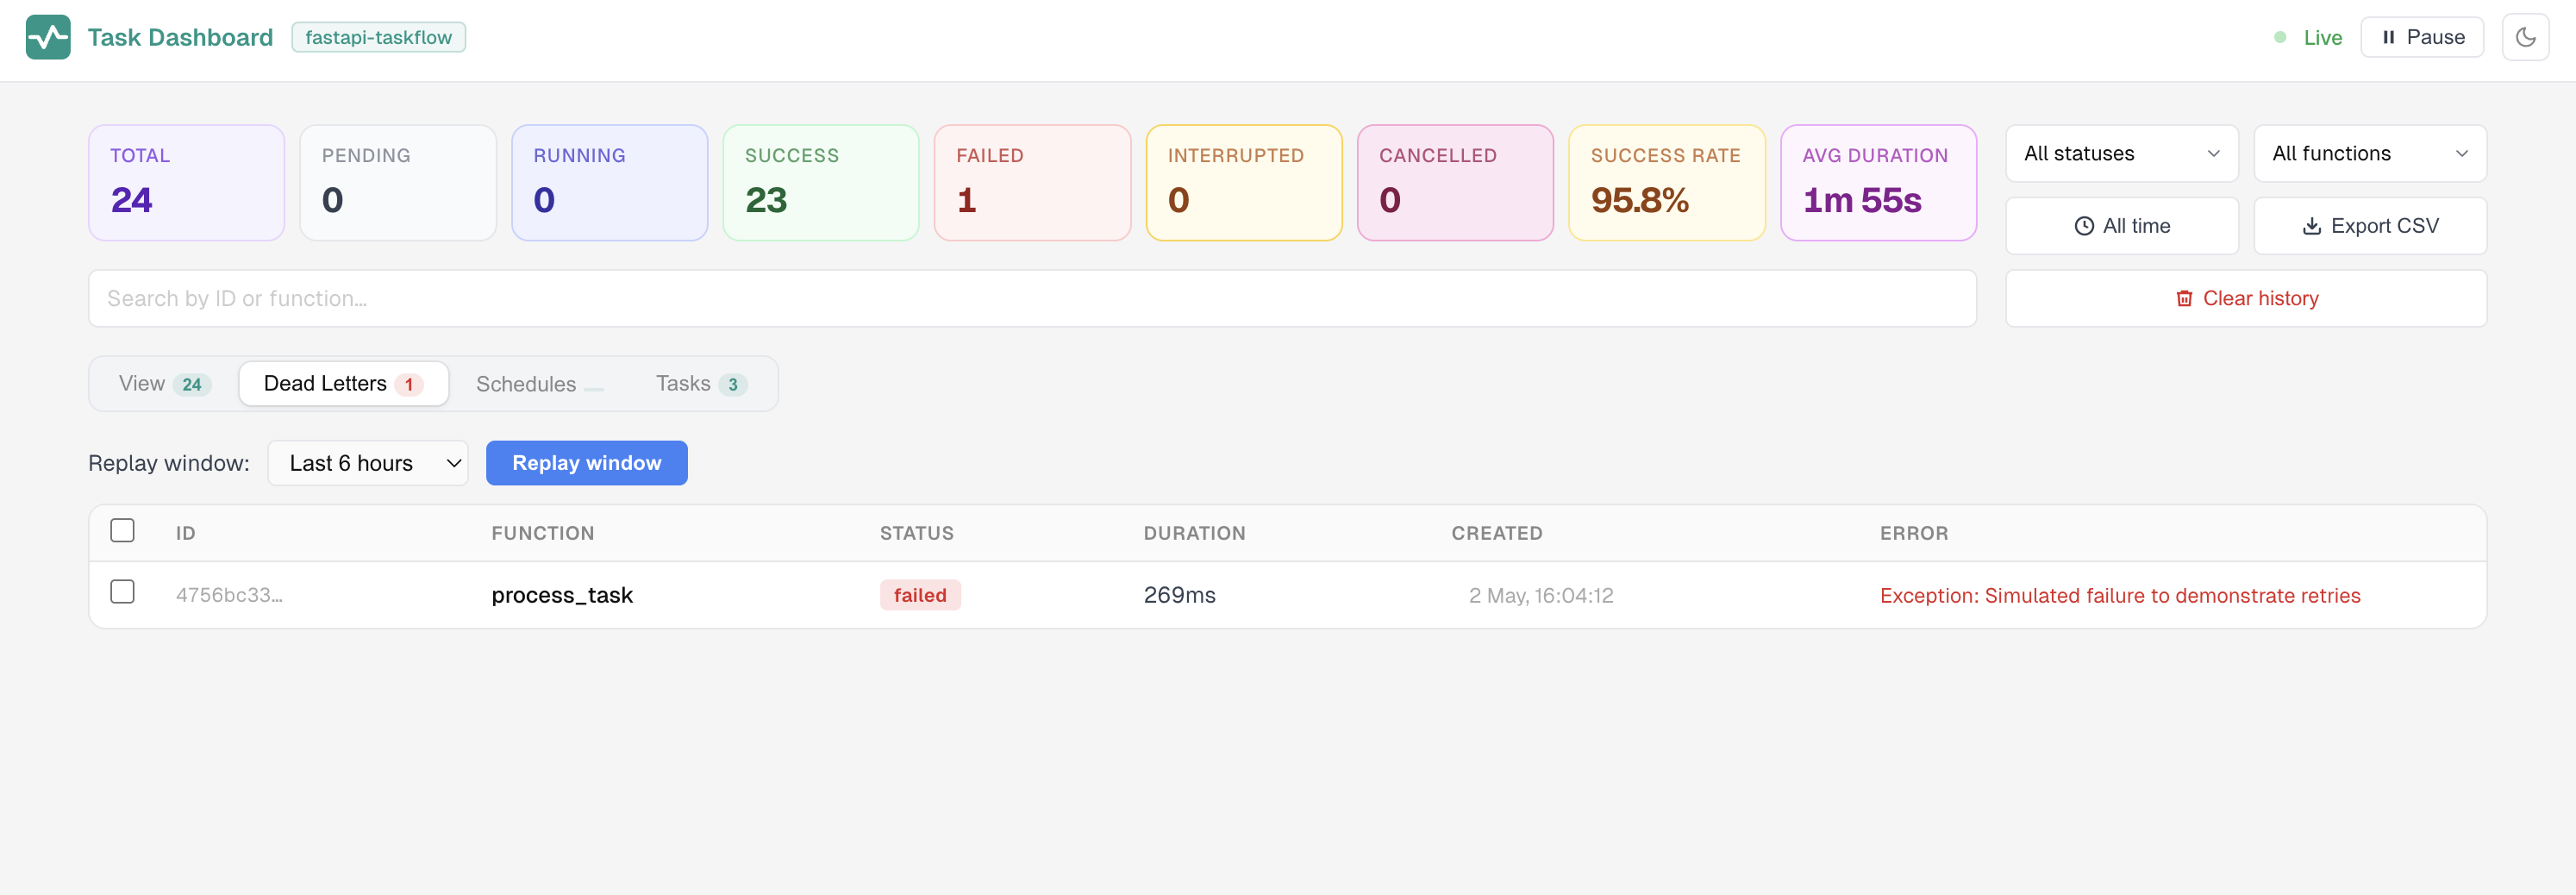
Retrying Individual Tasks
Each row in the Dead Letters table has a checkbox. Select one or more tasks, and a bulk action bar appears with a Replay selected button. Clicking it re-enqueues only the checked tasks with their original function, args, and kwargs. The selection clears automatically after dispatch.
When retry_replaces_original=True (the default), the original records are removed after the new tasks are dispatched. Only the new runs appear in the table.
Replaying by Time Window
A toolbar above the table lets you pick a time window (last 1 hour, 6 hours, 24 hours, 7 days, or all time) and click Replay window. A confirmation modal summarises how many tasks will be re-enqueued before anything is dispatched.
Note
Both replay actions are recorded in the audit log with action type bulk_retry.
Queues Tab
The Queues tab is only shown when the named queue system is active. It displays a live card for each configured named queue.
Each card shows:
| Field | Description |
|---|---|
| Queue name | The name as defined in TaskManager(queues={...}) |
| Type badge | full when the queue is at or above its max_size limit |
| Concurrency | Current concurrency limit. Unlimited when not set |
| Max size | Current backpressure limit. Unlimited when not set |
| Pending | Tasks currently waiting in the heap |
| Running | Tasks currently executing |
| Finished | Terminal tasks (success, failed, interrupted, cancelled) |
| Rejected | Tasks rejected because the queue was full |
Editing Queue Configuration
Each queue card has an Edit button. Clicking it makes the concurrency and max_size fields editable inline. Two buttons appear:
- Save applies the new values immediately. Changes take effect for new tasks entering the queue. In-flight tasks are not affected. The updated values are persisted to the backend and restored on the next startup.
- Cancel discards the changes and returns to the read-only view.
This lets you adjust queue limits at runtime without restarting the server, which is useful for throttling a queue under load or expanding capacity during a batch run.
Schedules Tab
The Schedules tab lists every function registered with @task_manager.schedule(). For each schedule you can see:
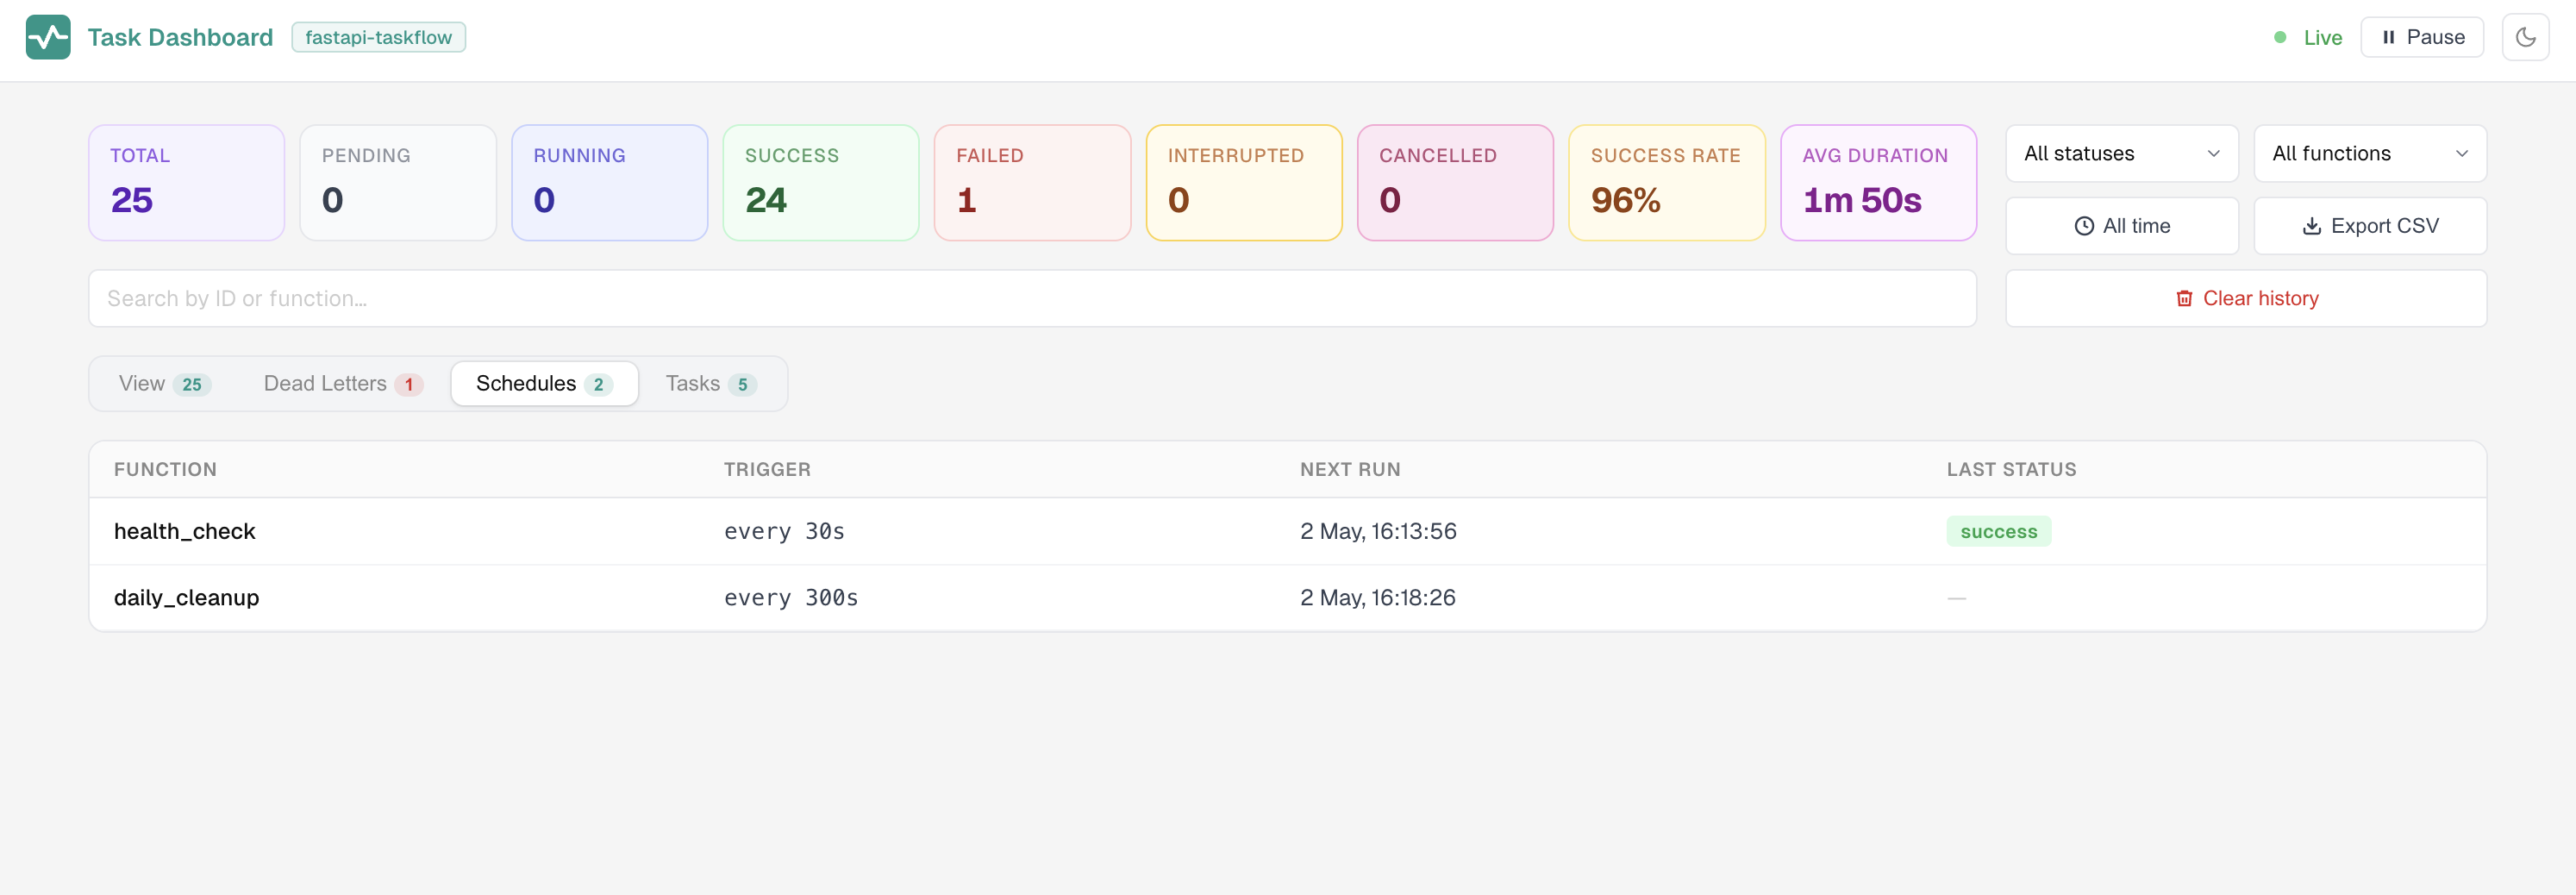
- The function name
- The trigger expression (an interval in seconds or a cron string)
- The next scheduled run time
- The status of the most recent run
Tasks Tab
The Tasks tab lists all functions registered with @task_manager.task() or @task_manager.schedule(). Each entry shows the function name along with its configuration: retry count, retry delay, backoff multiplier, and the boolean flags persist and requeue_on_interrupt.
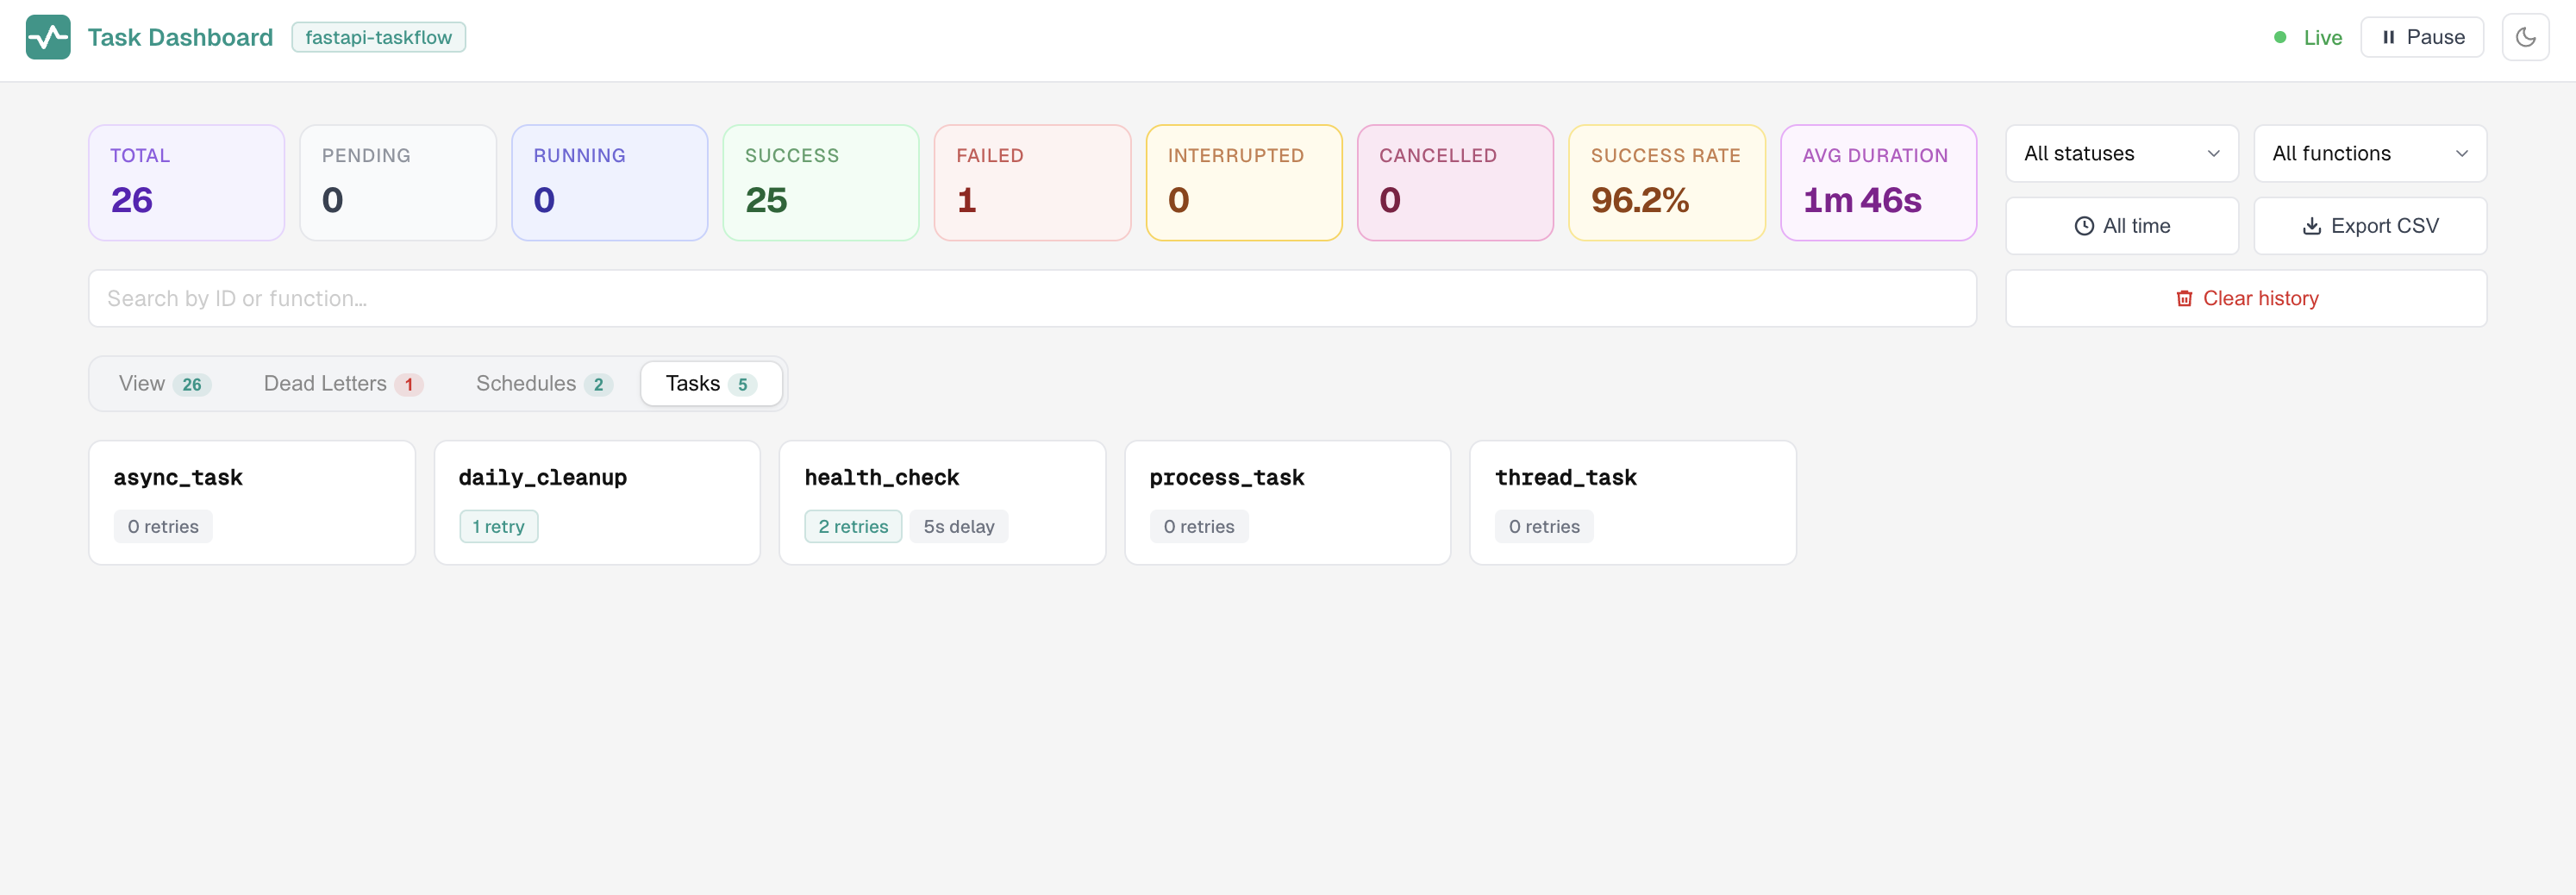
This is a convenient reference when you want to confirm what configuration is active for a given function.
Audit Tab
The Audit tab records every retry and cancel action taken via the dashboard or API. Each entry shows:
- Timestamp
- Action type (
retry,cancel, orbulk_retry) - The affected task ID
- The username of whoever performed the action
Info
The Audit tab is only shown when auth is configured on TaskAdmin. When auth is not configured, all actions are attributed to "anonymous" and the tab is hidden. The log keeps the last 1000 entries in memory.
Pausing Live Updates
The Pause button stops the dashboard from re-rendering as new SSE events arrive. Incoming events are buffered, and a counter shows how many new tasks have come in while updates are paused.
This is useful when you are inspecting a specific row or reading through task details and do not want the table to shift around underneath you. Click Resume to flush the buffer and catch up.
Exporting Tasks
The Export CSV button downloads the current filtered and sorted view as a .csv file named tasks-YYYY-MM-DD.csv. The export reflects whatever filters are active at the time you click.
Exported columns: ID, Function, Status, Duration (ms), Retries, Created, Error.
Clearing History
The Clear history button deletes completed tasks that are older than a window you choose. Only tasks with a terminal status (success, failed, cancelled, or rejected) are removed. Pending and running tasks are never deleted.
You can also configure automatic retention so old records are pruned on a schedule:
Or override the setting at mount time via TaskAdmin:
Pruning runs approximately every 6 hours during the snapshot loop.
Multi-Instance Deployments
When instance_url is configured on TaskManager, the dashboard shows a unified view of live tasks from all registered peer instances. Each SSE tick fans out to all live peers, fetches their in-memory tasks, and merges them with local tasks and the shared backend history.
Without instance_url, the dashboard shows only the tasks from the instance your browser's SSE connection is attached to, plus completed tasks from the shared backend.
Tip
For consistent live visibility when instance_url is not configured, route dashboard traffic to a single instance using sticky sessions. See the multi-instance guide for details.