Task Logging
This page explains how to emit log entries from inside a task, when to use each log level, and where those logs appear.
Why task_log exists
Inside a managed task, print() statements go to stdout and are not associated with the task record. If the task retries, you cannot tell which output came from which attempt. Logs are lost entirely when the process restarts.
task_log() solves this by writing entries directly to the task record in your configured backend (SQLite, Redis, or custom). Every log line is timestamped, labelled with its attempt number, and persisted alongside the task. They survive retries, process restarts, and are accessible from the dashboard, the API response, and any configured observer.
Basic usage
from fastapi_taskflow import task_log

@task_manager.task(retries=3, delay=1.0, backoff=2.0)
def send_email(address: str) -> None:
    task_log("Connecting to SMTP server")
    task_log(f"Sending to {address}")
Call task_log() anywhere inside a managed task function. No additional setup is required.
Log levels
Pass a level= keyword argument to classify the entry. The default level is "info".
task_log("Starting data sync", level="debug")
task_log("Sync complete")                             # defaults to "info"
task_log("Rate limit reached, retrying", level="warning")
task_log("Payment gateway returned 500", level="error")
Valid levels: "debug", "info", "warning", "error".
Choosing the right level
Use "debug" for step-by-step tracing you only want in development. Use "info" for normal progress milestones. Use "warning" for recoverable problems like rate limits or retries. Use "error" for failures that affect the outcome.
Observers such as FileLogger and StdoutLogger accept a min_level parameter, so you can suppress "debug" entries in production without removing them from the task record.
Structured extras
Pass keyword arguments to attach structured fields to the log entry. This is useful for filtering and querying in log aggregators like Loki, Datadog, or CloudWatch.
Here is a realistic example from an order processing task:
@task_manager.task(retries=3, delay=2.0)
def fulfill_order(order_id: str, customer_id: str) -> None:
    task_log(
        "Order received",
        order_id=order_id,
        customer_id=customer_id,
    )

    items = fetch_order_items(order_id)
    task_log(
        "Items fetched",
        order_id=order_id,
        item_count=len(items),
        total_value=sum(i["price"] for i in items),
    )

    charge_customer(customer_id, items)
    task_log(
        "Payment captured",
        order_id=order_id,
        customer_id=customer_id,
        level="info",
    )
The order_id, customer_id, item_count, and total_value fields are forwarded to every configured observer as LogEvent.extra. They do not appear in the dashboard log line itself, but they are available for structured queries in your aggregation tool.
Extras are for observers, not the dashboard
Structured extra fields are passed through to observer LogEvent payloads. The dashboard log panel shows only the message string and timestamp.
What retry separators look like
When a task retries, a --- Retry N --- separator is inserted automatically between attempts. This makes it straightforward to see what each attempt logged independently.
2026-04-01T10:00:00 Connecting to SMTP server
2026-04-01T10:00:01 Sending to user@example.com
--- Retry 1 ---
2026-04-01T10:00:05 Connecting to SMTP server
2026-04-01T10:00:05 Sending to user@example.com
--- Retry 2 ---
2026-04-01T10:00:13 Connecting to SMTP server
2026-04-01T10:00:14 Sending to user@example.com
Each block corresponds to one execution attempt. Combined with get_task_context().attempt, this makes it easy to write retry-aware logic alongside your logging.
Sync and async tasks
task_log() works identically in sync and async tasks. Sync tasks run in a thread pool, and log entries are handed back to the event loop safely.
@task_manager.task(retries=1)
def generate_report(user_id: int) -> None:
    task_log(f"Starting report for user {user_id}", user_id=user_id)
    data = fetch_data(user_id)
    task_log(f"Fetched {len(data)} records", count=len(data))
    task_log("Report complete")


@task_manager.task(retries=1)
async def process_webhook(payload: dict) -> None:
    task_log(f"Received event: {payload['type']}", event_type=payload["type"])
    await send_to_service(payload)
    task_log("Forwarded successfully")
Calling task_log outside a task context
When task_log() is called outside a running task (a direct function call, a script, a test), it does not silently discard the message. Instead, it forwards the call to the standard library logger fastapi_taskflow.task at the matching log level.
import logging
logging.basicConfig(level=logging.DEBUG)

# task_log() output is visible even when calling the function directly
send_email("user@example.com")
You can configure that logger using standard Python logging to control exactly where the output goes:
import logging

# Suppress fallback output entirely
logging.getLogger("fastapi_taskflow.task").setLevel(logging.CRITICAL)

# Route fallback output to a specific file
handler = logging.FileHandler("fallback.log")
logging.getLogger("fastapi_taskflow.task").addHandler(handler)
Safe in all call contexts
This fallback means task functions behave correctly whether called via add_task() in a route, from a management script, from a test, or from a cron job. You do not need to add any guards around task_log() calls.
Where logs appear
Log entries written with task_log() are accessible in three places:
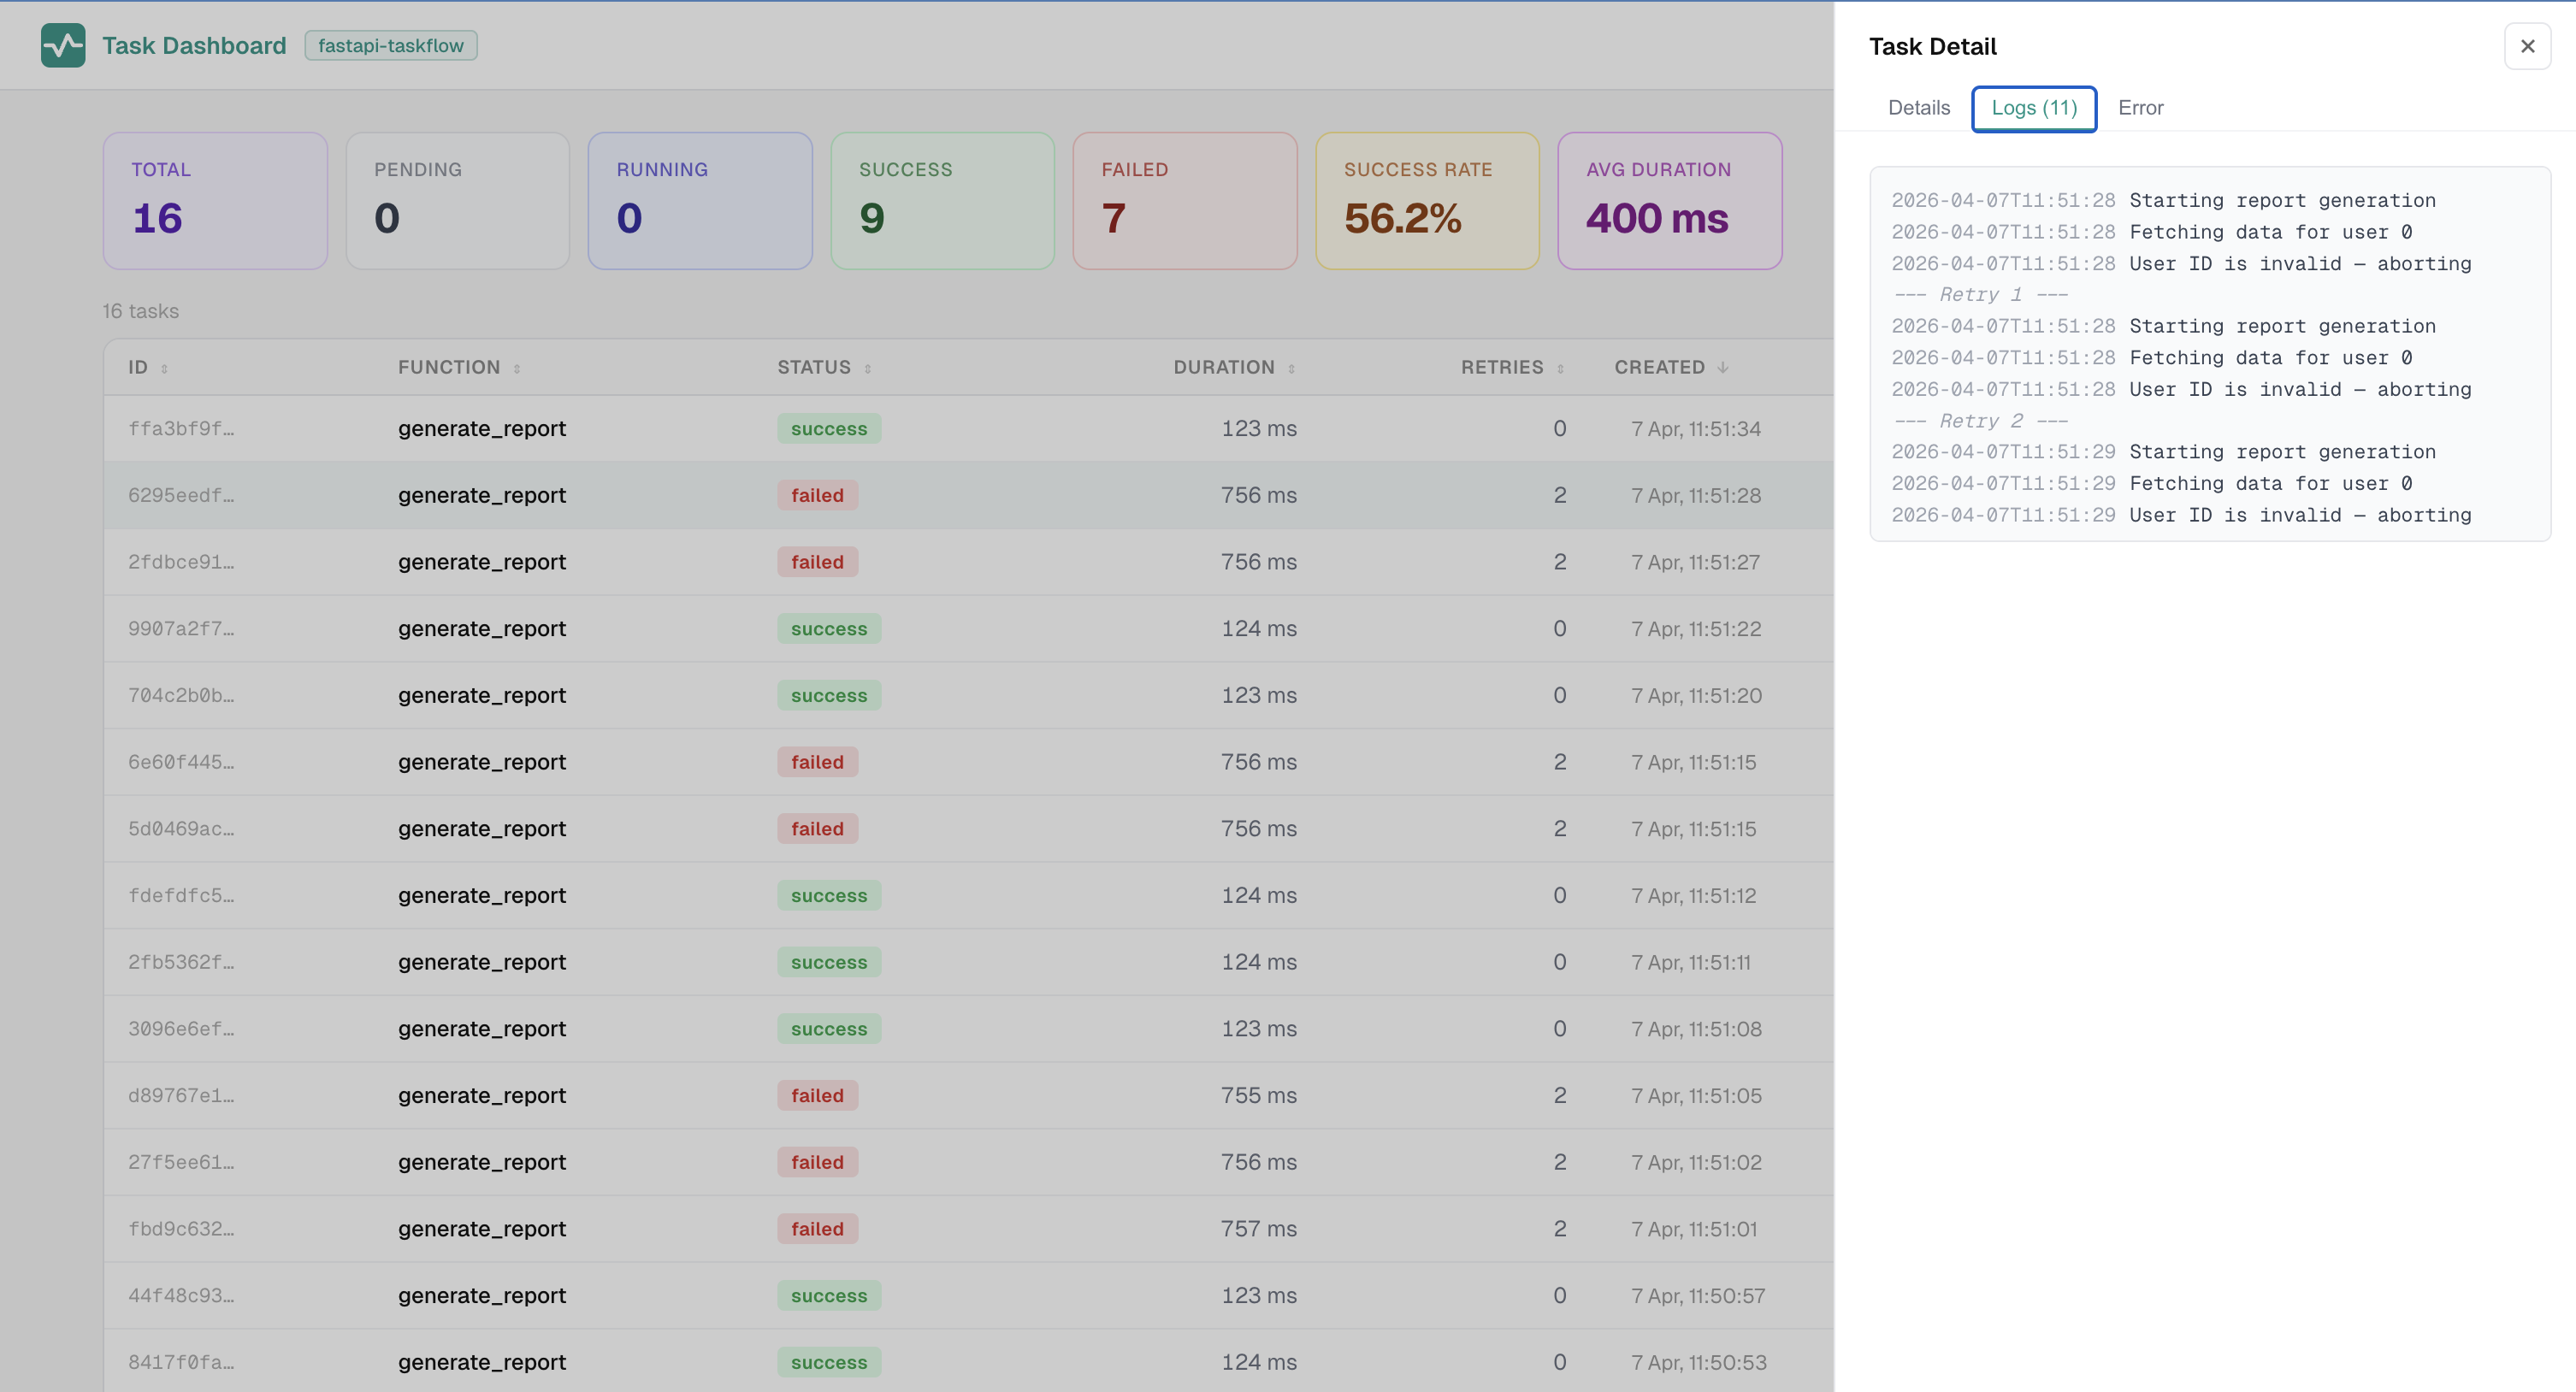
- Dashboard detail panel — the Logs tab shows timestamped entries for each attempt, separated by retry markers.
- API response — task detail responses from the Task Manager API include the full log list.
- Observer events — each
task_log()call dispatches aLogEventto every configured observer, includingFileLogger,StdoutLogger, and any custom observer you register.
Screenshots
Logs tab — timestamped entries per attempt, separated by retry markers:
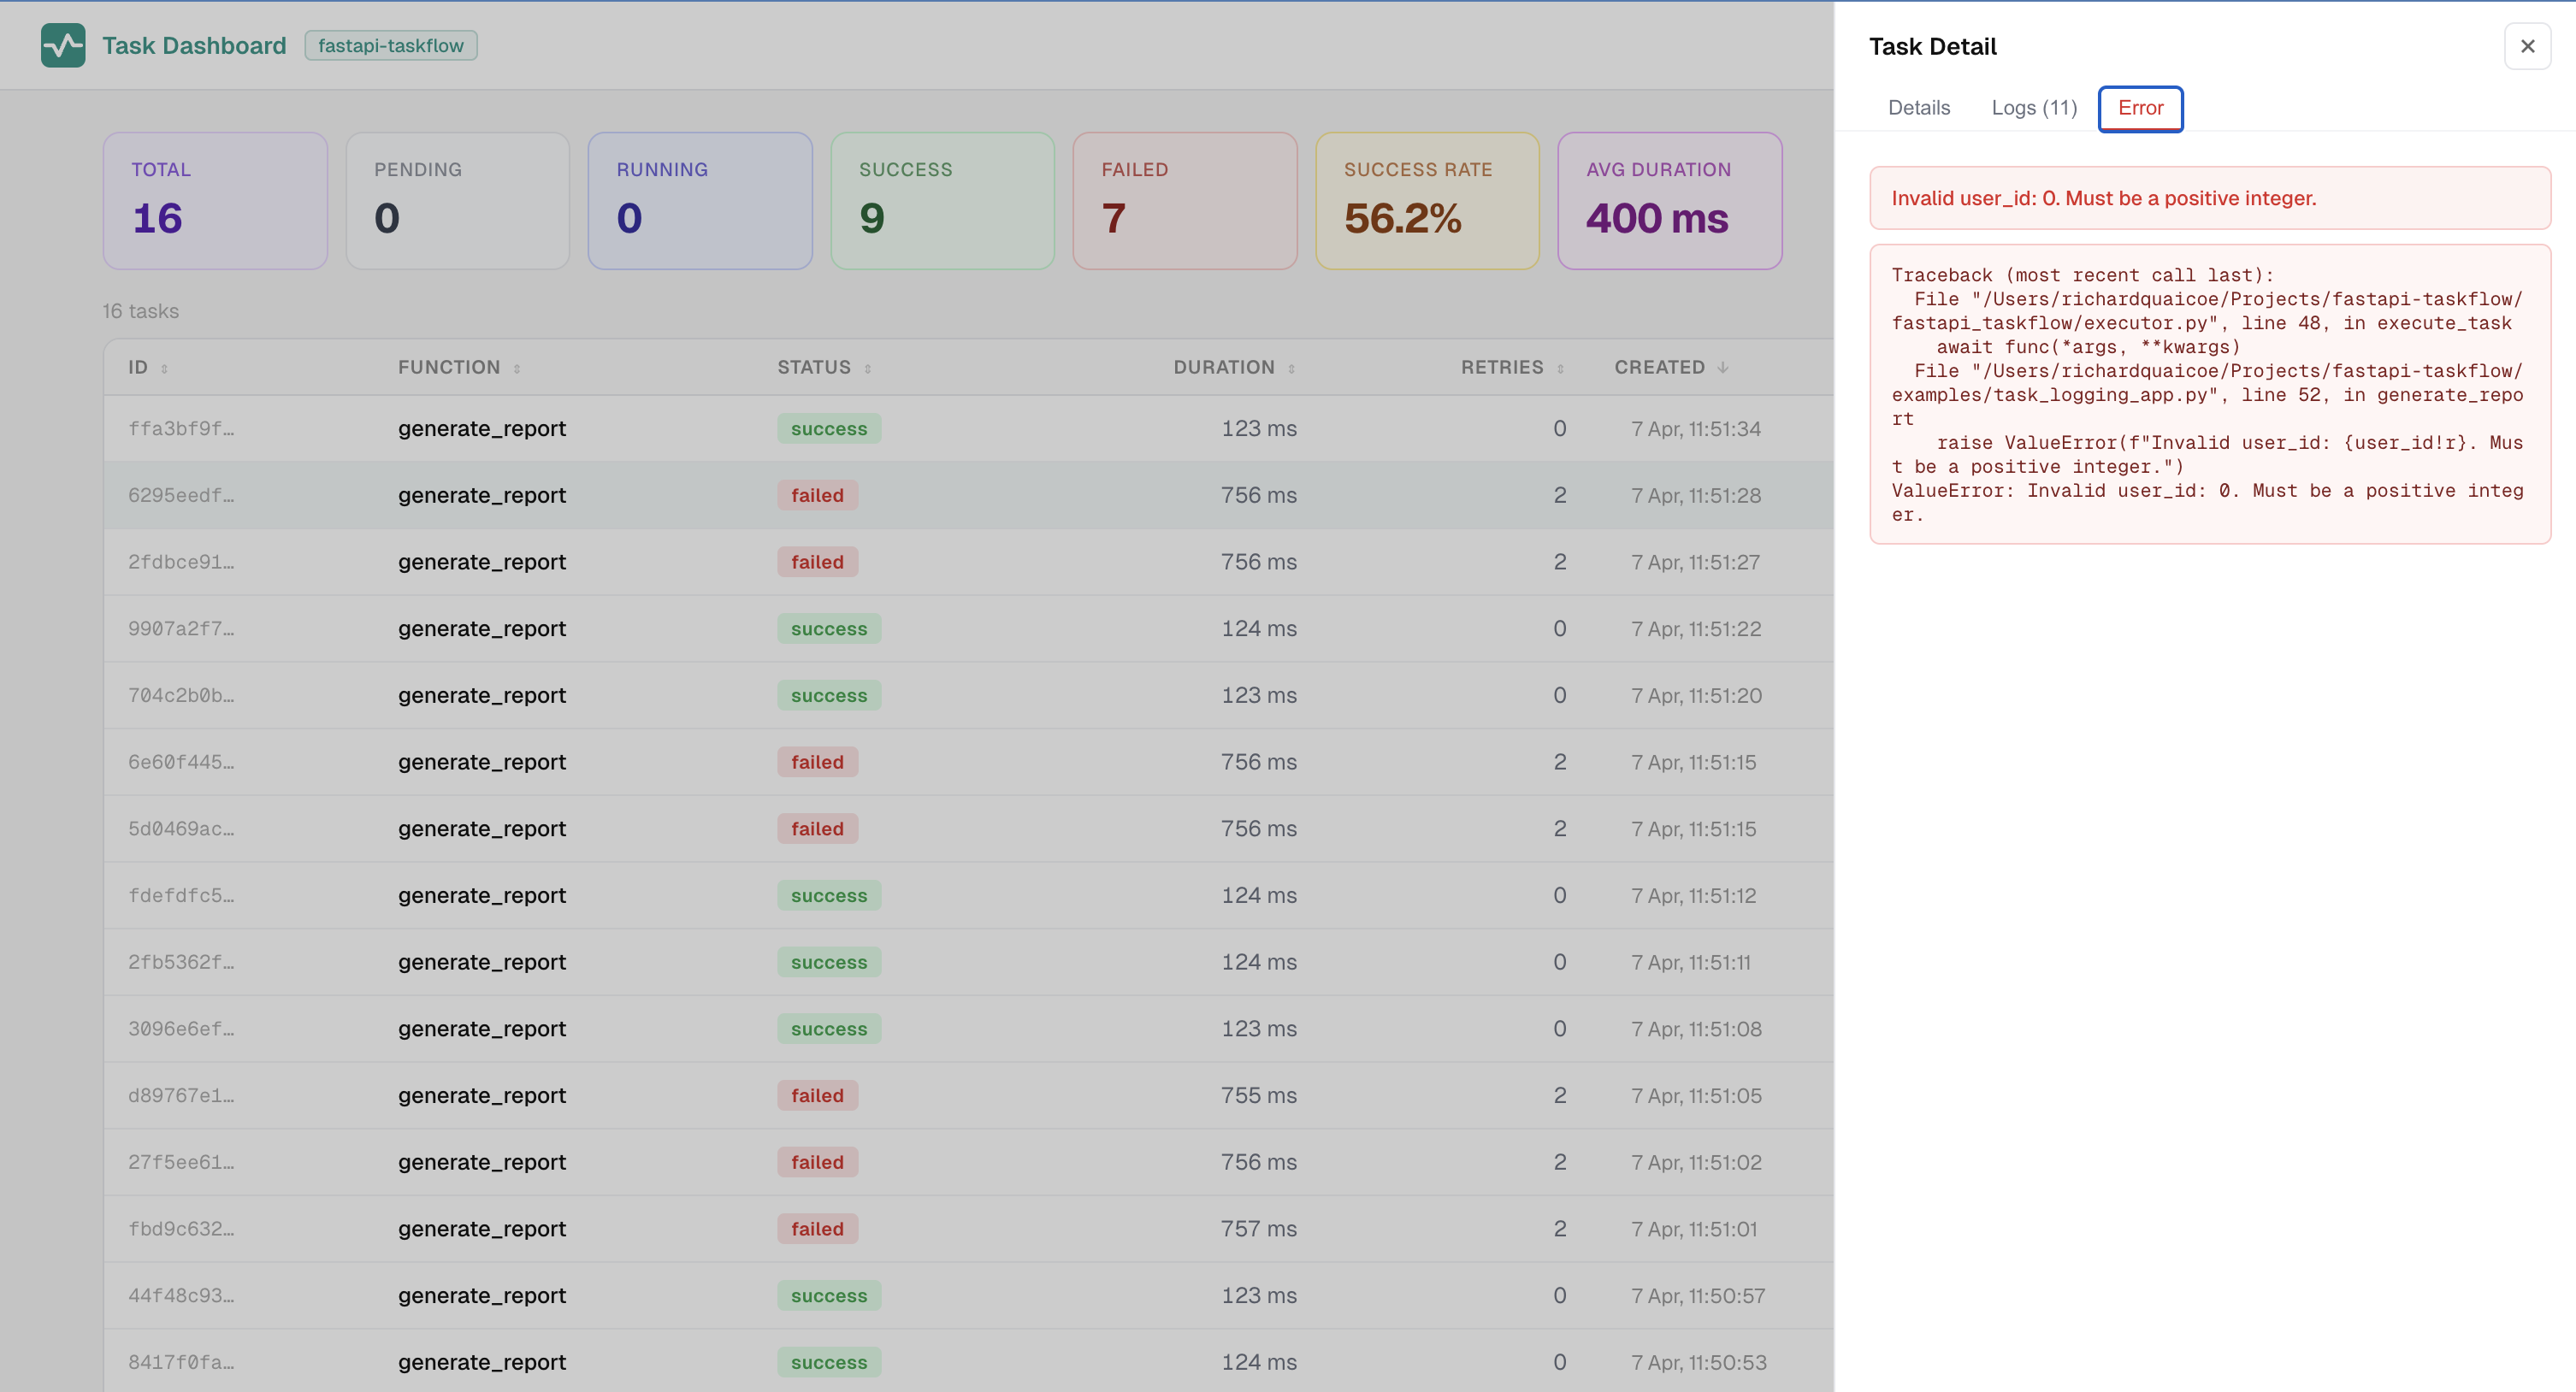
Error tab — error message and collapsible stack trace:
See also
- Task Context — access task metadata (task_id, attempt, tags) from inside any task
- Observability — send structured log events to files, stdout, or custom observers